Native Angeleno who has worked in public, academic and special libraries, as well as museums and college instruction. I am responsible for maintaining the Metro Transportation Library website, all of our social media properties, and digitization efforts to bring more of our resources to our users whenever they need them. For more information, visit The Metro Library website.

Wednesday, May 26, 2010

Hand-Held Museums: Is The Future Of History On Your Phone?

Contemporary street scene with 1953 image of soldier in Piccadilly Circus

In addition to transit and transportation news and research, we are also periodically highlighting innovations in libraries and archives which will shape the way we search for and find information in the future. New technologies are disseminated, adopted and embraced more quickly than ever, so we may see projects and ideas like this coming our way soon.

The Museum Of London has launched an iPhone application which brings its extensive art and photographic collections alive in advance of the opening of spectacular new galleries next week.

The free app, called "StreetMuseum," takes users to various sites in London where, via their iPhone screen, historical images of the city appear. Over 200 sites have been selected where users can look through their iPhones and see the past emerge.

While the historic images can be enjoyed by themselves, the real magic combines information from the image along with the location of the user. Geotagging metadata in the images and GPS technology in the phone are mashed up to overlay the user's location with historic information about the same place.

Here's how it works. The iPhone user opens the app and it determines the phone's location. A map then opens showing the users position and locations of the various sites where they can view historic images of London:

London 3-D view locations

When you touch one of the tags, a small window opens which describes the location, date, and creator of the image. One click of the blue arrow on the right of that window allows the image appear and be enlarged.

English suffragette Emmeline Pankhurst restrained by police outside Buckingham Palace, ca. 1908

If the user is in the location pictured, they can click on a "3D view" button which allows the app to recognize the location and overlay the historic image onto the current view, augmenting the reality that the built-in iPhone camera perceives.

Bomb destroys Bank Tube station, 1941

One can imagine that the appeal of this technology would not be limited to either this particular museum or London.

The veritable explosion of applications for iPhones and other smartphones means that we can expect to see historic images coming alive "in situ."

It is also worth noting that by the year 2020, mobile devices will be the primary connection tool to the internet for most Americans.

Painting of skaters on the frozen Thames River, 1677

Forward-thinking museums, libraries, archives, and universities will embrace placing interactive tools in the hands (literally) of everyone from history buffs to tourists walking through an unfamiliar city. Imagine what this would look like for Los Angeles. Our city is large, diverse and decentralized with a compelling history. It isn't the easiest place to learn about or navigate if one is not familiar with its layout or terrain.

Salvation Army Headquarters, Queen Victoria Street, May 10, 1941

Now imagine if a network of institutions such as L.A. As Subject (of which we are a member institution) pooled their visual resources to make a project such as this a reality.

Students, researchers, historians, tourists and others would be guided to and through our unique historic and cultural heritage, allowing everyone access to the stories and events that have made Los Angeles the subject of study for people throughout the region and around the world.

Until then, or at least until you bring your iPhone to London for real-time interactivity, you might enjoy Flickr's "Looking Into The Past" photo set (example below).

Easter Egg Roll at US Capitol, 1924, via Flickr

Friday, May 21, 2010

The "Original Downtown Regional Connector?": The 1954 Underground Bus Network Maps

Click on the map to open it, and again to enlarge it.

We wanted to follow up on yesterday's post about the proposed underground express bus network from the 1954 Supplemental Study Of Mass Transportation: Express Busses In Subways.

The study is accompanied by maps for the proposed subterranean bus network, which we have reproduced here with a few provisos.

First, they are not oriented in the way we are normally used to viewing maps. Rather than having north at the top of the page, the view is toward the southwest. Due north is at the lower right where one can locate the Four-Level Interchange and Chinatown below (north) of it.

Also, in order to provide the "big picture," the maps are reproduced here by piecing together three different pages from the original report. The original maps were published at slightly different scales, so the streets do not quite line up properly in the unified map.

The plan called for entrance to Downtown from the north, south, east and west.

From the north, buses would enter and exit the "Hollywood Parkway" at Hill Street and Spring Streets and travel underground starting at Temple into the Central Business District.

From the south, buses would approach and depart the planned "Olympic Parkway" at Hill Street and Main Street and travel underground starting at Pico Boulevard into the city's core.

From the west, express buses would connect to the "Harbor Parkway" at Olympic Boulevard and 7th Street and travel underground starting at Figueroa Street into the business district.

From the east, buses would enter and exit the center of downtown via 7th Street and an elevated roadway near 6th and San Pedro Streets.

Other features can be seen in these maps. The proposed "Riverside Parkway" was proposed for Elysian Park where Dodger Stadium now stands, and the "Industrial Parkway" was suggested for the eastside of downtown. It would balance out the Harbor Freeway on the west, and was supposed to run through the current-day Warehouse District and Arts District into the area just east of Union Station where Metro's Gateway Headquarters now stands.

While many transit plans from the past were never realized, it is worth noting that this study proposed integration of existing and new transit projects. The Hollywood Freeway and Harbor Freeway were already in existence, and planners anticipated freeways to the east and south of downtown with a futuristic underground bus network tying it all together to make it function as one system.

The "Riverside Parkway" and "Industrial Parkway" were never constructed. The "Olympic Parkway" is now known as the Santa Monica Freeway (I-10) running south of downtown to the ocean, and the Four-Level Interchange, the first "stack interchange" in the world, had just fully opened the year before in 1953.

It gives one pause to consider that plans for the current Downtown Regional Connector Transit Corridor also incorporate a new transit project to make existing ones function in a more integrated fashion. It "will enable all Los Angeles County rail and bus transit, as well as all intercity transit service, to operate more efficiently and attract higher ridership, thus reducing roadway congestion, improving regional air quality and reducing the region's carbon footprint."

While no one in 1954 was concerned with carbon footprints, the vexing problem of moving people in and out of central Los Angeles as smoothly as possible and connecting existing regional transit to new downtown projects was a primary concern more than half a century ago.

Thursday, May 20, 2010

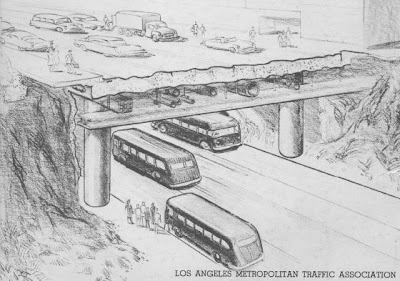
The 1954 Plan For Los Angeles' Underground Bus Network (Yes, Underground!)


As we proposed in our inaugural welcome post, our goal is to provide context for current transportation issues as well as to share the rich resources in our collections. Our ability to digitize items and share them online provides access to rarely-seen documents and other assets of both historical and current value.

Los Angeles transportation history is full of wonderful projects, proposals, people and other stories. Many of them are familiar (as is the mythology surrounding them) while others are not well-known at all.

A few weeks ago, we celebrated the 50th anniversary of Freeway Flyer service and recounted the inauguration of bus service bringing suburban workers downtown, which continues to this day.

Prior to the 1960 Freeway Flyer rollout, The Los Angeles Metropolitan Traffic Association released the 1953 Express Busses On Freeways Transit Study.

The following year, the Association issued a supplemental study to address how buses on freeways would get downtown workers into the Central Business District since the freeways did not penetrate the area and riders would have to transfer to other transit options. The 1954 Supplemental Study Of Mass Transportation: Express Busses In Subways submitted on January 24, 1955 must go down as one of the more eye-opening proposals in Los Angeles' colorful transportation history.

Several interesting and prescient (as well as some downright stunning) recommendations came out of this suppplemental study. They include:

Street Arcades
which contemplate set-back space to be taken out of frontage of buildings to make room for extra lanes on the street

Special Street Lane For Buses would set aside curb lane for use of buses and restrict certain streets exclusively to mass transportation

Intersection Separations provide for excavation and installation of escalators or ramps for pedestrians to cross below street surface, as well as escalators or ramps for crossing intersections above street surface

One-Way Street Proposals

Elevated Roadways in existing alleys for buses

Staggered Business Hours reinstating war-time requirements that not all businesses be open and closed at the same time, presumably mitigating traffic

Night Loading And Unloading of merchandise at street curbs during night hours

Fringe Parking lots serviced by shuttle buses or express buses on freeways operating downtown

Bus Subways providing "the most practical means of extending the freeway system through the Central Business District"

Yes, a "bus subway" was a serious proposal for carrying express buses from outlying freeways into downtown to avoid further contributing to congestion in the business district (recognized as the area bound by Figueroa Street, Sunset Boulevard, Los Angeles Street and Pico Boulevard). In fact, the proposal as submitted was regarded as "realizably cheap."

It recommended the "cut and cover" construction procedure as the most practical in the Central Business District, with work proceeding in "somewhat leisurely fashion with finish scheduled coincidentally with the Olympic Freeway south" of downtown.

Each of the proposals in this study are worthy of discussion, but it is the underground express bus network that really stands out, not only for its unique characteristics, but because it was featured on the front and back covers of the study. Those illustrations are featured here at the beginning and end of this post.

In the study's cover letter to the Board of Directors, the authors noted that "we herewith submit further studies -- limited, of course, because of lack of funds, staff, and time -- of the mass transportation problem in the Central Business District developed along such phases as seem essential now."

Their lack of funds, staff, and time should certainly not be regarded as any hindrance to their creativity.

Tomorrow, a thought-provoking look at the maps depicting where exactly this underground bus network would be located.

Monday, May 17, 2010

How We Commute: Moving Into The "State Of Metropolitan America"


Earlier this month, The Brookings Institution disseminated State Of Metropolitan America: On The Front Lines Of Demographic Transformation. This landmark 172-page report details the demographic and social trends shaping the nation’s essential economic and societal units—its large metropolitan areas—and discusses what they imply for public policies to secure prosperity for these places and their populations. (The 4-page Executive Summary provides an excellent overview).

The report's chapters discuss population and migration, race and ethnicity, immigration, age, households and families, educational attainment, work, income and poverty, and commuting.

The Commuting chapter holds some findings of particular interest. Commuting flows are the “blood” of regional economies, showing the connections among businesses and the labor market, and tying together the places that define our metropolitan areas. This subject area details how we get to work, how long it takes us, and how patterns in these indicators have changed over time, pointing to significant differences across communities in how workers undertake these daily trips.

Reversing a pair of 40-year trends, the share of Americans that commute by transit increased from 2000 to 2008, while the share of those that drive alone to work fell slightly. However, driving alone remains the method by which fully three-quarters of Americans get to work. Transit usage increased among whites and Asians, while carpooling dropped significantly among blacks and Hispanics.

Regional differences distinguish metropolitan commuting modes. Commuters drive alone to work in high proportions in mid-sized Midwestern and Southern metro areas like Youngstown and Baton Rouge. Carpooling is most popular in Southern and Western metro areas, including many with large Hispanic populations like Bakersfield and McAllen. Public transit commuting is concentrated in the nine large metro areas that have rates above the metropolitan average (7 percent), including New York, San Francisco, Washington, and Boston.

Metropolitan areas with large transit systems were not alone in seeing increased transit usage during the 2000s. While metropolitan areas such as New York and Washington with extensive rail networks saw the largest increases in the share of commuters using transit, metro areas that opened light rail lines this decade such as Charlotte and Phoenix saw upticks as well. Others that rely almost exclusively on buses for transit commuting (Colorado Springs, Albuquerque, and Seattle) also experienced notable increases.

In only 19 of the 100 largest metro areas did more than a quarter of the workforce in 2008 commute by a mode other than driving alone. In only two of those metropolitan areas (New York and San Francisco) did more than a quarter of workers commute other than by car. Carpooling is an important alternative to driving alone in both mid-sized (Honolulu, Stockton) and large (Los Angeles, Seattle) metro areas.

Residents of cities and older, high-density suburbs are more likely to use transit than commuters elsewhere in metro areas. Suburban transit users have higher incomes than both city transit users and suburbanites overall. Rates of working at home are roughly the same across cities and all types of suburbs, though more common among higher educated workers.

For some great infographics, check out this online interactive map section that accompanies the report.

Here, you can click on "commuting" in the subject drop down menu to view visual renderings of "workers commuting by driving alone," "travel time to work," "commuting mode by household income," etc. This section mashes up the data collected from the chapter subject areas outlined above to provide a wealth of visual information.

In addition to all the great information found in this report regarding commuting and how we can better plan for transit and transportation, it is also worth taking note of the seven new classifications of metropolitan areas that have emerged. Based on this demographic research, researchers and planners may be debating and studying the following new archetypes for years to come:

Next Frontier: metro areas that exceed national aver­ages on population growth, diversity and educa­tional attainment
New Heartland: metro areas that are also fast growing, highly educated locales, but have lower shares of Hispanic and Asian populations than the national average
Diverse Giant: metro areas that feature some of the largest in the country and post above-average educational attainment and diversity, but below-average population growth
Border Growth: metro areas that are mostly located in southern border states, and as such are marked by a significant and growing presence of Mexican and other Latin American immigrants
Mid-Sized Magnet: metro areas that have experienced high growth, but exhibit lower shares of Hispanic and Asian minorities, and lower levels of educational attainment
Skilled Anchors: slow-growing, less diverse metro areas that boast higher-than-average levels of educational attainment
Industrial Cores: slower-growing, less diverse, and less educated than national averages, and significantly older than the large metropolitan average

The primary policy message is that all levels of government need to understand these changes in order to more accurately prepare for the future. Given the broadening diversity of metropolitan areas, it is critical that communities within each region understand their unique challenges and opportunities and structure collaborative policy responses to meet these needs.

Image via Flickr.

Monday, May 10, 2010

Keeping Up With Public Transportation Research From TRB: Finding Publications, Conferences, Hearings, And RSS Feeds


The Transportation Research Board's Public Transportation Research website is a treasure-trove of great resources for what's happening in transportation innovation and progress. This site highlights recently released TRB reports, meeting announcements, requests for proposals, and other announcements related to public transportation.

In addition, it includes links to selected public transportation research-related activities taking place at the federal and state levels, and within the academic and international transportation communities. Finally, this page also highlights and provides links to TRB programs and activities.

Here's a look at just a few of the most recently available resources from the TRB Public Transportation Research website.

Transportation's Role In Reducing U.S. Greenhouse Gas Emissions (605p. PDF) examines greenhouse gas (GHG) emission levels and trends from the transportation sector and analyzes the full range of strategies available to reduce these emissions. These strategies include:
introducing low-carbon fuels
increasing vehicle-fuel economy
improving transportation system efficiency
reducing carbon-intensive travel activity
While the report does not provide recommendations, it does analyze five categories of policy options for implementing the strategies:
an economy-wide price signal
efficiency standards
market incentives
transportation planning and funding programs
research and development
Another recent publication of note is Estimating Soft Costs For Major Public Transportation Fixed Guideway Projects (144p. PDF). This report defines and describes soft costs and provides a new suggested methodology to estimate soft costs based on historical projects. The report also examines detailed technical information about the data collection, methodology, and statistical analysis that was used to develop the suggested methodology.

Yet another recent publication garnering a lot of attention is the American Association of State Highway and Transportation Officials' report that explores what is changing in America and the impact of those changes on the demand for new transportation capacity. The Case for Capacity: To Unlock Gridlock, Generate Jobs, Deliver Freight, and Connect Communities is the first volume published in a projected three volume set titled Transportation Reboot: Restarting America's Most Essential Operating System. Several underlying factors are currently undermining our ability to mitigate gridlock.

These include some startling considerations, like U.S. population growth since 1956 (when the Interstate Highway Act was enacted) increasing by 140 milion, that America's population is forecast to increase from 308 million today to more than 420 million by 2050, and that close to 80% of America's growth and economic development has concentrated in metropolitan areas.

AASHTO's four-pronged approach to "restarting" our transportation network include: preserving and modernizing the system, improving system performance, shifting trips to other options (such as intercity passenger rail, transit, bicycles or walking), shifting freight from trucks to rail, and adding the highway capacity needed to sustain America's future.

On April 21, 2010, the U.S. Senate Committee on Commerce, Science, and Transportation held a hearing to explore security issues related to the nation’s surface transportation systems. Opening remarks, witnesses’ submitted testimony, and a video of the hearing are now available online.

In conference news, TRB is sponsoring a Transportation Systems For Livable Communities Conference on October 18-19, 2010, in Washington, D.C. The livability concept embraces cognate notions such as sustainability, quality of life, the character of place, the health of communities, and more. The conference is designed to bring together researchers and practitioners interested in this topic and will provide a timely opportunity to share research results, explore practical challenges, and identify potentially promising directions for future research.

It can be challenging to keep up with the voluminous and valuable content on the Transportation Research Board's public transportation website, let alone the entire TRB site. A comprehensive list of RSS feeds is available to keep you informed of new research and publications in topics of interest.

Image from Idle Type via Flickr

Wednesday, May 5, 2010

50 Years Ago This Week: The Launch Of Freeway Flyer Service


Years before the El Monte Busway became the first dedicated freeway lanes for buses and decades before the Metro Silver Line began running, the Freeway Flyer service was created in response to increasing traffic congestion.

The exodus of Los Angeles' downtown workforce to the suburbs caused increased congestion and slower drive times for everyone. The Los Angeles Metropolitan Transit Authority created a pilot project in 1959 for a freeway bus system from the West San Fernando Valley to downtown.

On May 7, 1960, the Freeway Flyer Service was expanded to include the following areas (and pick-up / drop-off points):
West San Fernando Valley (Ventura Blvd. at Balboa Blvd. & Laurel Canyon Blvd.)
Central San Fernando Valley (Van Nuys Blvd. at Victory Blvd.)
Hollywood (Sunset Blvd. at Laurel Canyon Blvd.)
Soutside (Broadway at 116th St.)
San Gabriel Valley (West Covina)
Centinela Valley (LaBrea at Arbor Vitae)
Harbor Area (San Pedro)
Advertisements in local newspapers touted "fast new service melts miles and minutes off the map" and "Here's how to live closer to your job without moving." The newest buses of the day, the "Dreamliner/60," promised "the most comfortable ride you've ever had" with "handsome, relaxing, decorator-designed interiors."

While commuters were now offered luxurious transit options into downtown, planners had their sights set on something far more comprehensive: the monorail-based mass transit proposal of 1960 envisioned a 74.9 mile system (51 miles of overhead routes, 21.6 miles at grade, 2.3 miles in tunnel) that could eventually expand to a 150-mile, eight-corridor system.


By 1962, the monorail plan was scrapped and gave way to early subway plans, but freeway service continues to this day, via Metro's Express Service to/from Downtown Los Angeles and the LADOT Commuter Express.

Tuesday, May 4, 2010

The Key To Transportation Research: Harnessing The Wealth Of Information In The TRB Databases


The Transportation Research Board (TRB) recently conducted a webinar that explored practical tips for searching the Transportation Research Information Services (TRIS), Research In Progress (RIP), and Research Needs Statements (RNS) databases.

This 90-minute session, titled "Knowledge Is Power: How TRB's Databases Improve Access To Transportation Research," is now available for free online.

The presenters provide an overview of each database, offer tips on how to refine searches for greater accuracy and relevancy, and demonstrate advanced features added last year. These databases are critical to comprehensive, accurate research in the transportation field. The panelists also discuss ways they use TRB databases to enhance their research programs.

The Transportation Research Information Services (TRIS) database is the largest online bibliographic database of transportation research. TRIS now contains more than 650,000 records of published research covering all modes and disciplines of transportation. TRIS is produced and maintained by the Transportation Research Board of the National Academies with sponsorship by state Departments of Transportation and the administration of the U.S. Department of Transportation, and other sponsors of TRB’s core technical activities. These records cover government and academic technical reports, journal articles, conference proceedings, studies and statistics. Approximately 10% of these records contain links to full-text online sources. Citations and abstracts are provided for the other 90% of items. We will review how to get full-text access to these resources in a future post.

The Research In Progress database allows users to browse project records by subject, use a look-up directory for individuals and organizations, subscribe to receive email notification of new RIP records in specific subject areas, and submit current research projects.

An important function of the Transportation Research Board (TRB) is to stimulate research that addresses concerns, issues, or problems facing the transportation community. In support of this function, TRB Technical Activities standing committees identify, develop, and disseminate Research Need Statements (RNS) for use by practitioners, researchers, and others. The RNS in this database have been developed by the technical committees.